Modelling Q4 Model 3 Deliveries
***** NOTE: 12/25 *****
One more mistake to correct. I estimated 507 Dec deliveries in TMC, based on the number of undelivered configurations. However, it appears I drastically underestimated how many of those were "ghost" entries that were abandoned before delivery. It now appears that Dec deliveries in TMC will come in around 330 at most. That makes total TMC deliveries 934. NY sample rate was 2.38%, but assuming that's 20% higher than average, we get 1.9% sample rate. That implies ~50K deliveries in Q4.
So my first estimate was high on Dec deliveries, but low on sample rate. The final result is about 2K higher.
***** NOTE: 12/16 1PM PST*****
After publishing this, I did some more analysis that makes me question my conclusions here.
1) It's become more clear that 20% of Sept VINS are simply missing from NMVTIS. This has implications both for the NMVTIS-based predictions and for the NY registrations (if we assume 20% of NY regs are simply missing as well)
2) Closer scrutiny of TMC entries for NY shows that NY tends to skew towards buyers with "reservations" more than TMC as a whole. I don't know why this happens, but it implies that the inferred sample rate from TMC-NY is higher than the sample rate for TMC as a whole.
I haven't worked through the implications, but just ballparking seems like ~55K might be closer.
I think the lesson here is- we really can't estimate Q3 sales, at least not with the data I have access to. So the number above is a best-guess, but one with large error bars. My previous estimate (48K) is probably a reasonable lower-bound, but even that is uncertain.
There are too many screwy things going on to make an unbiased estimate based on data alone. It comes down to judgements about how to adjust various data points. Once you do that, you're not really making a data-based estimate, but rather making an estimate based on your judgements.
*************************
TL;DR: 48K M3 deliveries for Q4. If this disagrees with your estimates, please find holes/errors in the methodology.
I'm short TSLA (ahem, disclosure, ahem), so I'm very interested in Model 3 delivery action. A core short thesis is that there isn't 5k/wk demand (let alone 10k) for a $60K car with catastrophically low initial quality.
So far, TSLA has been able to deliver lots of M3s to enthusiasts who've been waiting 2+ years. But what happens when those enthusiasts run out? I believe that's what we're starting to see here at the end of Q4. But the point of data analysis is to test your beliefs, so let's set aside any priors about market demand and see what the data tells us?
[Side note: If you are interested in the Q4 guessing game, I highly recommend putting your guesses into Troy's Q4 guess sheet here.]
The TMC sheet tracks a number of interesting parameters. It has configuration date (when the user ordered the car), delivery date (if delivered or scheduled for delivery), configuration, and State/Country of user. These parameters can be used in a variety of ways to estimate deliveries.
As a baseline, we could assume 3.29% is a reasonable estimate, then extrapolate from there. For instance, as of this writing, the sheet is tracking 857 deliveries for Q3, so that's 26K deliveries. However, the sample rate is not constant. We know it's changed from quarter to quarter. It generally tends to drop over time. This is because the early adopters are bigger fans. The earlier you ordered your M3, the more into Tesla you are, and the more likely you are to be on the TMC website and want to track data.
In particular, Reservation holders tend to be much more likely to enter their information into TMC than non-Reservation holders. So as Tesla has worked through priority Reservations, then filled in "walk-up" orders, the sample rate has declined. For reference, the sample rate was nearly 5% in Q2 dropping the 3.28% in Q3.
So if sample rate is changing, how can we use TMC data to predict Q4 deliveries? If there were some way to get a ground truth for deliveries, we could use that ground truth to estimate sample rate and from there get an estimate for the whole quarter.
In principle, we now have a ground truth for deliveries. We can see how many Model 3's were delivered in NY in Oct & Nov. Unfortunately, it's not that simple. Tesla, unlike every other OEM, is VERY slow in registering vehicles. The evidence is undeniable, the reasons for their behavior more murky. In any case, it presents something of a problem, as the Nov registrations for Tesla are incomplete. Oct is better- it's probably missing a few cars, but by Dec 1, most Oct registrations have been entered.
So how do we get to a NY ground truth? Fortunately others who track this data have looked at the historical performance- ie. how slow Tesla is in registering. From the behavior in previous months, we can estimate what % of total registrations in NY we've seen as of Dec 1. The empirical answer is 95% for Oct and 45% for Nov.
The 45% estimate is the weakest, most error prone assumption in this whole post. It's empirically derived from previous months, but we don't know if Tesla's behavior may have changed. The true number might turn out to be 60% or 35%- neither would be shocking. That said, let's see what these numbers tell us.
From TMC, we can see which state a user took delivery in. There were 7 deliveries for NY in Oct, and 17 in Nov. Now we can estimate sample rate. 7/365 is 1.9%, 17/642 is 2.65%. Given the small #'s it's probably better to take the sum and average, which gives us 2.38%. This is now our estimate for Q4 sample rate. In short, TMC has 24 deliveries for NY in Oct+Nov, and we believe 1007 actually took place.
TMC tracked 240 deliveries in Oct, and 354 in Nov. Dividing by the sample rate (2.38%) yields 12,500 for Oct and 13,400 for Nov, approximately 26K total.
What about December? Well December isn't over. TMC is tracking 267 cars delivered or scheduled for delivery in December. But we know that Tesla will deliver more. In fact, Tesla has promised to deliver ALL current US orders by Dec 31st. So let's assume they make good on that. There are currently 240 configurations made since Sept that do not have a delivery date. We'll assume that all of these will be delivered. That's probably not right. Some are Canadian and some are "ghost" entries which have been delivered (or cancelled) but not cleaned up from the sheet. However, we'll be very conservative (i.e erroring on the side of too many deliveries), and assume every blank will be delivered in Dec. That means that we expect TMC to have 507 Dec deliveries.
507 December entries translates to 21300 deliveries. Note that this tracks well with known Tesla behavior, where the 3rd month in a quarter has 50% higher deliveries. Summing the three months, we get 12,500+13,400+21,300 = 47,400. Let's round that up to 48K since I'm a TSLA bear and my biases are to the negative side.
Our sample rate estimate is based on a small number of actual samples- 24. The variance on this is pretty high- the true number could be 22 or 26 quite easily. This doesn't "bias" or estimate one way or the other, but it does increase the error bars substantially. The true sample rate might easily be as low as 2.2% or as high as 2.6%.
We're also assuming the sample rate from Oct+Nov is constant to Dec. I believe this is a solid assumption. While it's true that generally the sample rate drops over time, the introduction of the MR has increased the number of reservation holders making configurations. Overall the percent of TMC entries with reservations has been stable from Oct/Nov to Dec. Overall, it's probably a small risk leaning towards more deliveries than estimated.
For December, I'm assuming that every undelivered entry in TMC since Sept will be delivered. However, we know there are a lot of "ghost" entries. These entries are users who either forgot to update the sheet once they took delivery, or cancelled their order. About 20% of configs end up as ghosts, but the percent "ghost" increases the older a configuration is, as the non-ghosts fill in delivery information leaving only ghosts. Of the 240 unscheduled deliveries, it wouldn't surprise me if 30% turned out to be ghosts. That represents about 3k cars.
On the other hand, the tax credit is running out and it's possible we'll see a lot of last minute purchases, plus other stunts by Tesla to juice Q4 sales. This is another way of saying Dec sample rate will drop because of last minute "walk up" sales. I've no idea how to measure this, but I'd be surprised if we saw more than a 2-3K of such sales. Spending $50K on a car isn't typically a last-minute thing, especially one that doesn't have a lease option.
There are 2 problems with this. First, NMVTIS only tracks 46 states, accounting for about 95% of US cars, so it's missing a 5% of US data and ALL of Canada. Second, as we've mentioned before, Tesla is SLOW in registering vehicles, so even now, NMVTIS only has about 91% of M3's sold in October.
As of 12/15 NMVTIS had 91,445 M3's registered which represents about 96,300 US cars. Given we know Tesla had delivered ~80K M3's in the US through Q3, that's only 16,300 new registrations in Q4 so far. While Tesla is extremely slow at registering vehicles, the small number of registrations means Oct + Nov couldn't be that big.
The NMVTIS data is consistent with ~13K in Oct and 14.5K in Nov (assuming Tesla is really slow in registering cars). We can roundly discount InsideEV's estimate of 36.3K for Oct+Nov. If Tesla delivered that many cars in the US, it didn't register about 25% of them at all*.
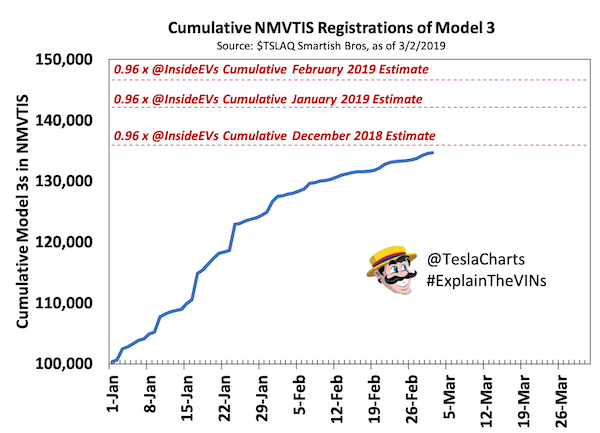
*NOTE: There is mounting evidence that Tesla has in fact failed to register a large number of vehicles starting in Sept- as many as 6K from Sept alone. If you take an M3 VIN known to have been sold in Sept, and check its title with a title record provider like VinSmart or VinCheck.info (the latter will give you a free record if you give up your email), you'll find that about 20% of these cars don't show up. You can see a chart of this discrepancy here, courtesy of the inimitable TeslaCharts.
It's been ~80 days since the last Sept M3 was sold. Why these vehicles are not being properly registered we don't know. However, it does confound this analysis. If 6K titles are missing from Sept (and possible a similar amount from Oct), the number of possible Q3 sales is substantially higher than 27.5K.
It's 1 DC and I've no idea how to gauge the accuracy of the estimates, but it does align squarely with my estimates, and was made completely independently (though we need TMC to estimate Colorado).
One more mistake to correct. I estimated 507 Dec deliveries in TMC, based on the number of undelivered configurations. However, it appears I drastically underestimated how many of those were "ghost" entries that were abandoned before delivery. It now appears that Dec deliveries in TMC will come in around 330 at most. That makes total TMC deliveries 934. NY sample rate was 2.38%, but assuming that's 20% higher than average, we get 1.9% sample rate. That implies ~50K deliveries in Q4.
So my first estimate was high on Dec deliveries, but low on sample rate. The final result is about 2K higher.
***** NOTE: 12/16 1PM PST*****
After publishing this, I did some more analysis that makes me question my conclusions here.
1) It's become more clear that 20% of Sept VINS are simply missing from NMVTIS. This has implications both for the NMVTIS-based predictions and for the NY registrations (if we assume 20% of NY regs are simply missing as well)
2) Closer scrutiny of TMC entries for NY shows that NY tends to skew towards buyers with "reservations" more than TMC as a whole. I don't know why this happens, but it implies that the inferred sample rate from TMC-NY is higher than the sample rate for TMC as a whole.
I haven't worked through the implications, but just ballparking seems like ~55K might be closer.
I think the lesson here is- we really can't estimate Q3 sales, at least not with the data I have access to. So the number above is a best-guess, but one with large error bars. My previous estimate (48K) is probably a reasonable lower-bound, but even that is uncertain.
There are too many screwy things going on to make an unbiased estimate based on data alone. It comes down to judgements about how to adjust various data points. Once you do that, you're not really making a data-based estimate, but rather making an estimate based on your judgements.
*************************
TL;DR: 48K M3 deliveries for Q4. If this disagrees with your estimates, please find holes/errors in the methodology.
I'm short TSLA (ahem, disclosure, ahem), so I'm very interested in Model 3 delivery action. A core short thesis is that there isn't 5k/wk demand (let alone 10k) for a $60K car with catastrophically low initial quality.
So far, TSLA has been able to deliver lots of M3s to enthusiasts who've been waiting 2+ years. But what happens when those enthusiasts run out? I believe that's what we're starting to see here at the end of Q4. But the point of data analysis is to test your beliefs, so let's set aside any priors about market demand and see what the data tells us?
Introducing Troy & the TMC Order Sheet
The primary resource for this exercise is the TMC Order Sheet maintained by the excellent TroyTeslike. If you are not familiar with the sheet, it tracks orders for Model 3's from the Tesla faithful. With a prominent place on the TMC forums, it has historically tracked a reasonable % of all Model 3 orders. As of this writing, over 3600 deliveries have been captured in its rows.[Side note: If you are interested in the Q4 guessing game, I highly recommend putting your guesses into Troy's Q4 guess sheet here.]
The TMC sheet tracks a number of interesting parameters. It has configuration date (when the user ordered the car), delivery date (if delivered or scheduled for delivery), configuration, and State/Country of user. These parameters can be used in a variety of ways to estimate deliveries.
TMC Sample Rate
The problem with the TMC sheet is that it captures only some unknown percentage of deliveries. For instance, in Q3, the sheet tracked 1843 deliveries. From Tesla, we know there were actually 56,065 Model 3's delivered. So empirically, the sheet tracked 3.29% of orders.As a baseline, we could assume 3.29% is a reasonable estimate, then extrapolate from there. For instance, as of this writing, the sheet is tracking 857 deliveries for Q3, so that's 26K deliveries. However, the sample rate is not constant. We know it's changed from quarter to quarter. It generally tends to drop over time. This is because the early adopters are bigger fans. The earlier you ordered your M3, the more into Tesla you are, and the more likely you are to be on the TMC website and want to track data.
In particular, Reservation holders tend to be much more likely to enter their information into TMC than non-Reservation holders. So as Tesla has worked through priority Reservations, then filled in "walk-up" orders, the sample rate has declined. For reference, the sample rate was nearly 5% in Q2 dropping the 3.28% in Q3.
So if sample rate is changing, how can we use TMC data to predict Q4 deliveries? If there were some way to get a ground truth for deliveries, we could use that ground truth to estimate sample rate and from there get an estimate for the whole quarter.
NY Open Data To the Rescue!
It turns out that New York State has started releasing government data on an open website. If you haven't discovered the joys of data.ny.gov, I highly recommend it. The site allows you to query all vehicle registrations over date range for specific makes. The data is updated monthly.In principle, we now have a ground truth for deliveries. We can see how many Model 3's were delivered in NY in Oct & Nov. Unfortunately, it's not that simple. Tesla, unlike every other OEM, is VERY slow in registering vehicles. The evidence is undeniable, the reasons for their behavior more murky. In any case, it presents something of a problem, as the Nov registrations for Tesla are incomplete. Oct is better- it's probably missing a few cars, but by Dec 1, most Oct registrations have been entered.
So how do we get to a NY ground truth? Fortunately others who track this data have looked at the historical performance- ie. how slow Tesla is in registering. From the behavior in previous months, we can estimate what % of total registrations in NY we've seen as of Dec 1. The empirical answer is 95% for Oct and 45% for Nov.
The 45% estimate is the weakest, most error prone assumption in this whole post. It's empirically derived from previous months, but we don't know if Tesla's behavior may have changed. The true number might turn out to be 60% or 35%- neither would be shocking. That said, let's see what these numbers tell us.
Inferring From NY
New York says that 348 M3's were registered in Oct and 292 in Nov. If we apply our "correction" to these numbers, our estimates for NY delivery are 365 and 642 respectively. So how does this help us estimate all deliveries?From TMC, we can see which state a user took delivery in. There were 7 deliveries for NY in Oct, and 17 in Nov. Now we can estimate sample rate. 7/365 is 1.9%, 17/642 is 2.65%. Given the small #'s it's probably better to take the sum and average, which gives us 2.38%. This is now our estimate for Q4 sample rate. In short, TMC has 24 deliveries for NY in Oct+Nov, and we believe 1007 actually took place.
Deliveries by Month
Now that we have a sample rate estimate, we can estimate Oct & Nov deliveries.TMC tracked 240 deliveries in Oct, and 354 in Nov. Dividing by the sample rate (2.38%) yields 12,500 for Oct and 13,400 for Nov, approximately 26K total.
What about December? Well December isn't over. TMC is tracking 267 cars delivered or scheduled for delivery in December. But we know that Tesla will deliver more. In fact, Tesla has promised to deliver ALL current US orders by Dec 31st. So let's assume they make good on that. There are currently 240 configurations made since Sept that do not have a delivery date. We'll assume that all of these will be delivered. That's probably not right. Some are Canadian and some are "ghost" entries which have been delivered (or cancelled) but not cleaned up from the sheet. However, we'll be very conservative (i.e erroring on the side of too many deliveries), and assume every blank will be delivered in Dec. That means that we expect TMC to have 507 Dec deliveries.
507 December entries translates to 21300 deliveries. Note that this tracks well with known Tesla behavior, where the 3rd month in a quarter has 50% higher deliveries. Summing the three months, we get 12,500+13,400+21,300 = 47,400. Let's round that up to 48K since I'm a TSLA bear and my biases are to the negative side.
Sources of Error
Now that we have our estimate, let's figure out where we could have gone wrong. As I've already mentioned, the Nov estimate for Tesla NY registrations is possibly error prone. Given that we don't really understand why Tesla is so slow to register vehicles, it's always dangerous to assume the behavior will be constant. I don't know anyway to minimize this error. On the positive side, the Oct estimate is pretty solid, and the trend implied- Nov somewhat higher than Oct- is consistent with the trend other observers have seen, though smaller in magnitude.Our sample rate estimate is based on a small number of actual samples- 24. The variance on this is pretty high- the true number could be 22 or 26 quite easily. This doesn't "bias" or estimate one way or the other, but it does increase the error bars substantially. The true sample rate might easily be as low as 2.2% or as high as 2.6%.
We're also assuming the sample rate from Oct+Nov is constant to Dec. I believe this is a solid assumption. While it's true that generally the sample rate drops over time, the introduction of the MR has increased the number of reservation holders making configurations. Overall the percent of TMC entries with reservations has been stable from Oct/Nov to Dec. Overall, it's probably a small risk leaning towards more deliveries than estimated.
For December, I'm assuming that every undelivered entry in TMC since Sept will be delivered. However, we know there are a lot of "ghost" entries. These entries are users who either forgot to update the sheet once they took delivery, or cancelled their order. About 20% of configs end up as ghosts, but the percent "ghost" increases the older a configuration is, as the non-ghosts fill in delivery information leaving only ghosts. Of the 240 unscheduled deliveries, it wouldn't surprise me if 30% turned out to be ghosts. That represents about 3k cars.
On the other hand, the tax credit is running out and it's possible we'll see a lot of last minute purchases, plus other stunts by Tesla to juice Q4 sales. This is another way of saying Dec sample rate will drop because of last minute "walk up" sales. I've no idea how to measure this, but I'd be surprised if we saw more than a 2-3K of such sales. Spending $50K on a car isn't typically a last-minute thing, especially one that doesn't have a lease option.
Another Estimate: NMVTIS
Independent of TMC and NY data, we can estimate Oct/Nov sales by tracking data in NMVTIS. The National Motor Vehicle Title System collects registration data from 46 states into a single database. By tracking how many Model 3's are in the database, we can estimate sales.There are 2 problems with this. First, NMVTIS only tracks 46 states, accounting for about 95% of US cars, so it's missing a 5% of US data and ALL of Canada. Second, as we've mentioned before, Tesla is SLOW in registering vehicles, so even now, NMVTIS only has about 91% of M3's sold in October.
As of 12/15 NMVTIS had 91,445 M3's registered which represents about 96,300 US cars. Given we know Tesla had delivered ~80K M3's in the US through Q3, that's only 16,300 new registrations in Q4 so far. While Tesla is extremely slow at registering vehicles, the small number of registrations means Oct + Nov couldn't be that big.
The NMVTIS data is consistent with ~13K in Oct and 14.5K in Nov (assuming Tesla is really slow in registering cars). We can roundly discount InsideEV's estimate of 36.3K for Oct+Nov. If Tesla delivered that many cars in the US, it didn't register about 25% of them at all*.
*NOTE: There is mounting evidence that Tesla has in fact failed to register a large number of vehicles starting in Sept- as many as 6K from Sept alone. If you take an M3 VIN known to have been sold in Sept, and check its title with a title record provider like VinSmart or VinCheck.info (the latter will give you a free record if you give up your email), you'll find that about 20% of these cars don't show up. You can see a chart of this discrepancy here, courtesy of the inimitable TeslaCharts.
It's been ~80 days since the last Sept M3 was sold. Why these vehicles are not being properly registered we don't know. However, it does confound this analysis. If 6K titles are missing from Sept (and possible a similar amount from Oct), the number of possible Q3 sales is substantially higher than 27.5K.
Anecdata
Tesla shorts have been tracking sales at some specific delivery centers that represent entire states. By tracking the movement of trucks, they can compute fairly accurately how many Model 3's a DC is moving. In particular, an observer has carefully tracked the sole delivery center in Colorado. He estimates 90 M3s per week. In TMC, Colorado represents 2.45% of M3 deliveries in Q4. If we multiply 90/wk * 13 wk * 2.45% sample rate we end up with 47.7K deliveries.It's 1 DC and I've no idea how to gauge the accuracy of the estimates, but it does align squarely with my estimates, and was made completely independently (though we need TMC to estimate Colorado).
Comments
You mention that Tesla is very slow to report VINs. I would suggest that may be due to inadequate staffing of that department as the Model 3 ramp accelerated. As the number of deliveries soared, the throughput of the license department did not grow as fast, creating longer and longer delays for VIN registration. At some point, Tesla likely reacted to this and staffed up the department to try and clear the back log. That will take some time, to train the new people up to speed, and get ahead of the higher delivery rates in 4Q than earlier in the year (1st and 2nd quarters).
All of that is a long winded way of saying that I think the historical factors for 1 and 2 month out coverage (95% of October and 45% of November) are likely biased high. If the VIN delay has grown over the past few months, then those numbers are likely high. But that is looking through the rose colored glasses of a long Tesla investor.
I did want to say again that I really enjoyed the analytical approach. I have an article hopefully coming on SeekingAlpha on Monday that takes a numerical approach to sustained Model 3 demand, and would love if you had a chance to look at it. I tried to stay as unbiased as possible, but I know some bias filters through, would be good to see where my optimism overrides good numerical modeling.